

Key Takeaways
- No single fitness metric tells the full story of your health or fitness level.
- Calorie burn estimates from wearables can carry errors of 20–30% or more depending on the device and activity.
- VO2 max and HRV are advanced metrics that reflect cardiovascular fitness and recovery capacity over time.
- Trends across days and weeks are more meaningful than any single day's reading.
- Fitness tracker data supplements — but never replaces — guidance from a qualified healthcare provider.
Fitness Tracker Dashboard Metrics
Fitness tracker dashboard metrics are the numeric readings — such as steps taken, heart rate, calories burned, and sleep stages — that wearable devices and apps calculate from sensor data and algorithms. Each metric attempts to translate raw physiological signals into an understandable number. Understanding what those numbers actually measure, and how accurately, helps you use them to make better health decisions rather than chasing figures that may not reflect your goals.
Most consumer wearables use accelerometers, optical photoplethysmography (PPG) sensors, and proprietary algorithms to estimate metrics; accuracy varies by device, skin tone, body position, and activity type.
Steps and Active Minutes: A Starting Point, Not the Whole Story
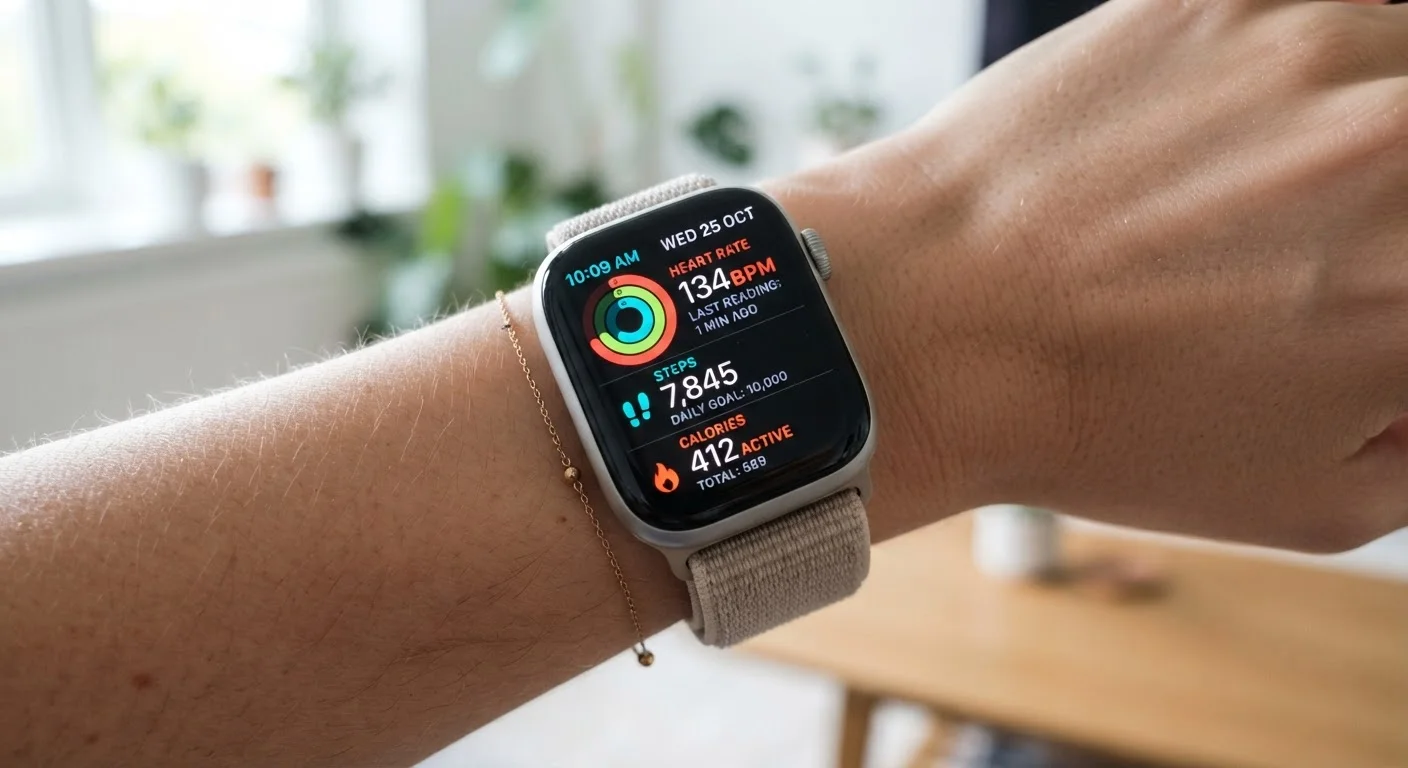
Step count is the most familiar tracker metric, and for good reason — it's simple and motivating. Your device's accelerometer detects wrist or hip movement and translates that motion into estimated steps. Active minutes (sometimes called "move minutes" or "exercise minutes") go a step further, flagging periods when your movement intensity exceeds a moderate threshold.
Both metrics are useful entry points, but neither captures the full picture of physical activity. Cycling, swimming, and weight training may register fewer steps than their actual effort warrants. Step count alone is an incomplete fitness picture — pairing it with heart rate and active minutes gives a more rounded view of your daily movement.
Focus on Weekly Trends, Not Daily Fluctuations
Individual daily readings can be thrown off by sensor placement, skin temperature, or activity type. Instead of reacting to a single day's data, look at rolling 7-day averages for metrics like resting heart rate, HRV, and step count. Consistent trends across multiple weeks carry far more meaning than any single data point.
Calorie Burn: Understand the Margin of Error
Fitness trackers estimate total calorie expenditure by combining your basal metabolic rate (BMR) — the calories your body burns at rest — with an activity multiplier derived from movement and heart rate data. To understand how BMR and total daily energy expenditure relate to each other, see our explainer on TDEE vs. BMR.
The critical caveat: consumer device calorie estimates carry substantial uncertainty. Published studies have found errors ranging from roughly 15% to over 40% depending on the device, the activity type, and individual physiology. Calorie numbers are best used to identify relative patterns — such as whether Tuesday's workout burned more energy than Monday's — rather than as precise totals to plug into nutrition decisions.
~27%
Average calorie burn error in wearable devices
A Stanford University study found consumer fitness trackers had a median error of about 27% for energy expenditure across seven popular devices.
7,000+
Daily steps linked to significant mortality reduction
Research published in JAMA Network Open found that walking approximately 7,000 or more steps per day was associated with meaningfully lower all-cause mortality risk in middle-aged adults.
60 ms
Typical resting HRV range for healthy adults
HRV values vary widely by age, fitness, and individual physiology; your personal baseline trend matters more than comparison to population averages.
Heart Rate Metrics: Resting, Zones, and Variability
Heart rate data is where wearables begin to reveal deeper physiological insight. Three distinct readings each tell a different story:
- Resting heart rate (RHR): Measured during sleep or stillness, RHR reflects cardiovascular efficiency. A downward trend in RHR over weeks typically signals improving aerobic fitness. A sudden unexplained spike may indicate illness, dehydration, or overtraining.
- Heart rate zones: Zones divide exercise intensity into bands — typically from light (50–60% of max heart rate) to maximum effort. Training across different zones in a structured way supports both endurance and cardiovascular health. For a deeper explanation of zones alongside VO2 max, see our plain-English reference on VO2 max and heart rate zones.
- Heart rate variability (HRV): HRV measures millisecond fluctuations between heartbeats. It reflects how well your autonomic nervous system is recovering. Many devices report a morning HRV score; consistent declines may signal inadequate recovery.
VO2 Max: Your Cardiorespiratory Fitness Estimate
VO2 max represents the maximum volume of oxygen your body can use during intense exercise, expressed in milliliters per kilogram of body weight per minute (mL/kg/min). It is considered one of the strongest predictors of long-term cardiovascular health. In a clinical setting, it is measured with specialized equipment during a graded exercise test.
Consumer wearables estimate VO2 max algorithmically — typically by analyzing the relationship between your heart rate and running pace over time. These estimates are not equivalent to lab measurements, but they can reliably track directional change. If your estimated VO2 max is trending upward over months of consistent training, that is a meaningful positive signal regardless of the absolute number.
“VO2 max is one of the best objective measures we have of cardiovascular fitness and long-term health risk — but its value lies in tracking change over time, not in fixating on a single number.”
— American College of Sports Medicine, Leading professional organization for exercise science and sports medicine
Sleep Scores and Recovery Metrics: Useful but Approximate
Many trackers now report sleep stages — light, deep, and REM — alongside an overall sleep score. These estimates are generated from movement data and heart rate patterns, not the electrical brain activity (EEG) used in clinical sleep studies. They provide a reasonable approximation of sleep duration and broad architecture, but should not be used to self-diagnose sleep disorders.
Recovery scores (sometimes called "readiness" scores) synthesize RHR, HRV, sleep quality, and recent activity load into a single number meant to guide daily training intensity. Treat these as useful prompts rather than prescriptions. For a fuller view of how sleep, activity, and nutrition data work together, explore how to track activity, nutrition, and sleep as an integrated system.
A word of caution: some people find that obsessing over sleep scores worsens their rest. If tracking is increasing anxiety rather than reducing it, that is a signal worth heeding. See when fitness tracking becomes counterproductive for guidance on keeping tracking in a healthy balance.
This article is for informational purposes only and does not constitute medical advice. Always consult a qualified healthcare professional before making changes to your health routine or if you have concerns about any metrics your device reports.